Rapid forest loss around Medco Papua Hijau mill in Papua, the beginnings of traceability (Papua palm oil production Part 1)
Deforestation for palm oil production has again received international attention in light of allegations that plantation linked to major household names has been encroaching on protected peatland area. We thought this would be a good opportunity to look at the broader picture of palm oil activities in Papua, including the distribution of palm oil mills laudably released under a supply chain transparency drive provided by Unilever; and examine these location and long-term forest change. This comes as a two-part special, focusing on two cases where rapid forest loss has occurred around known palm oil mill locations. Dr. Penny How reports.
Papua and Papua New Guinea
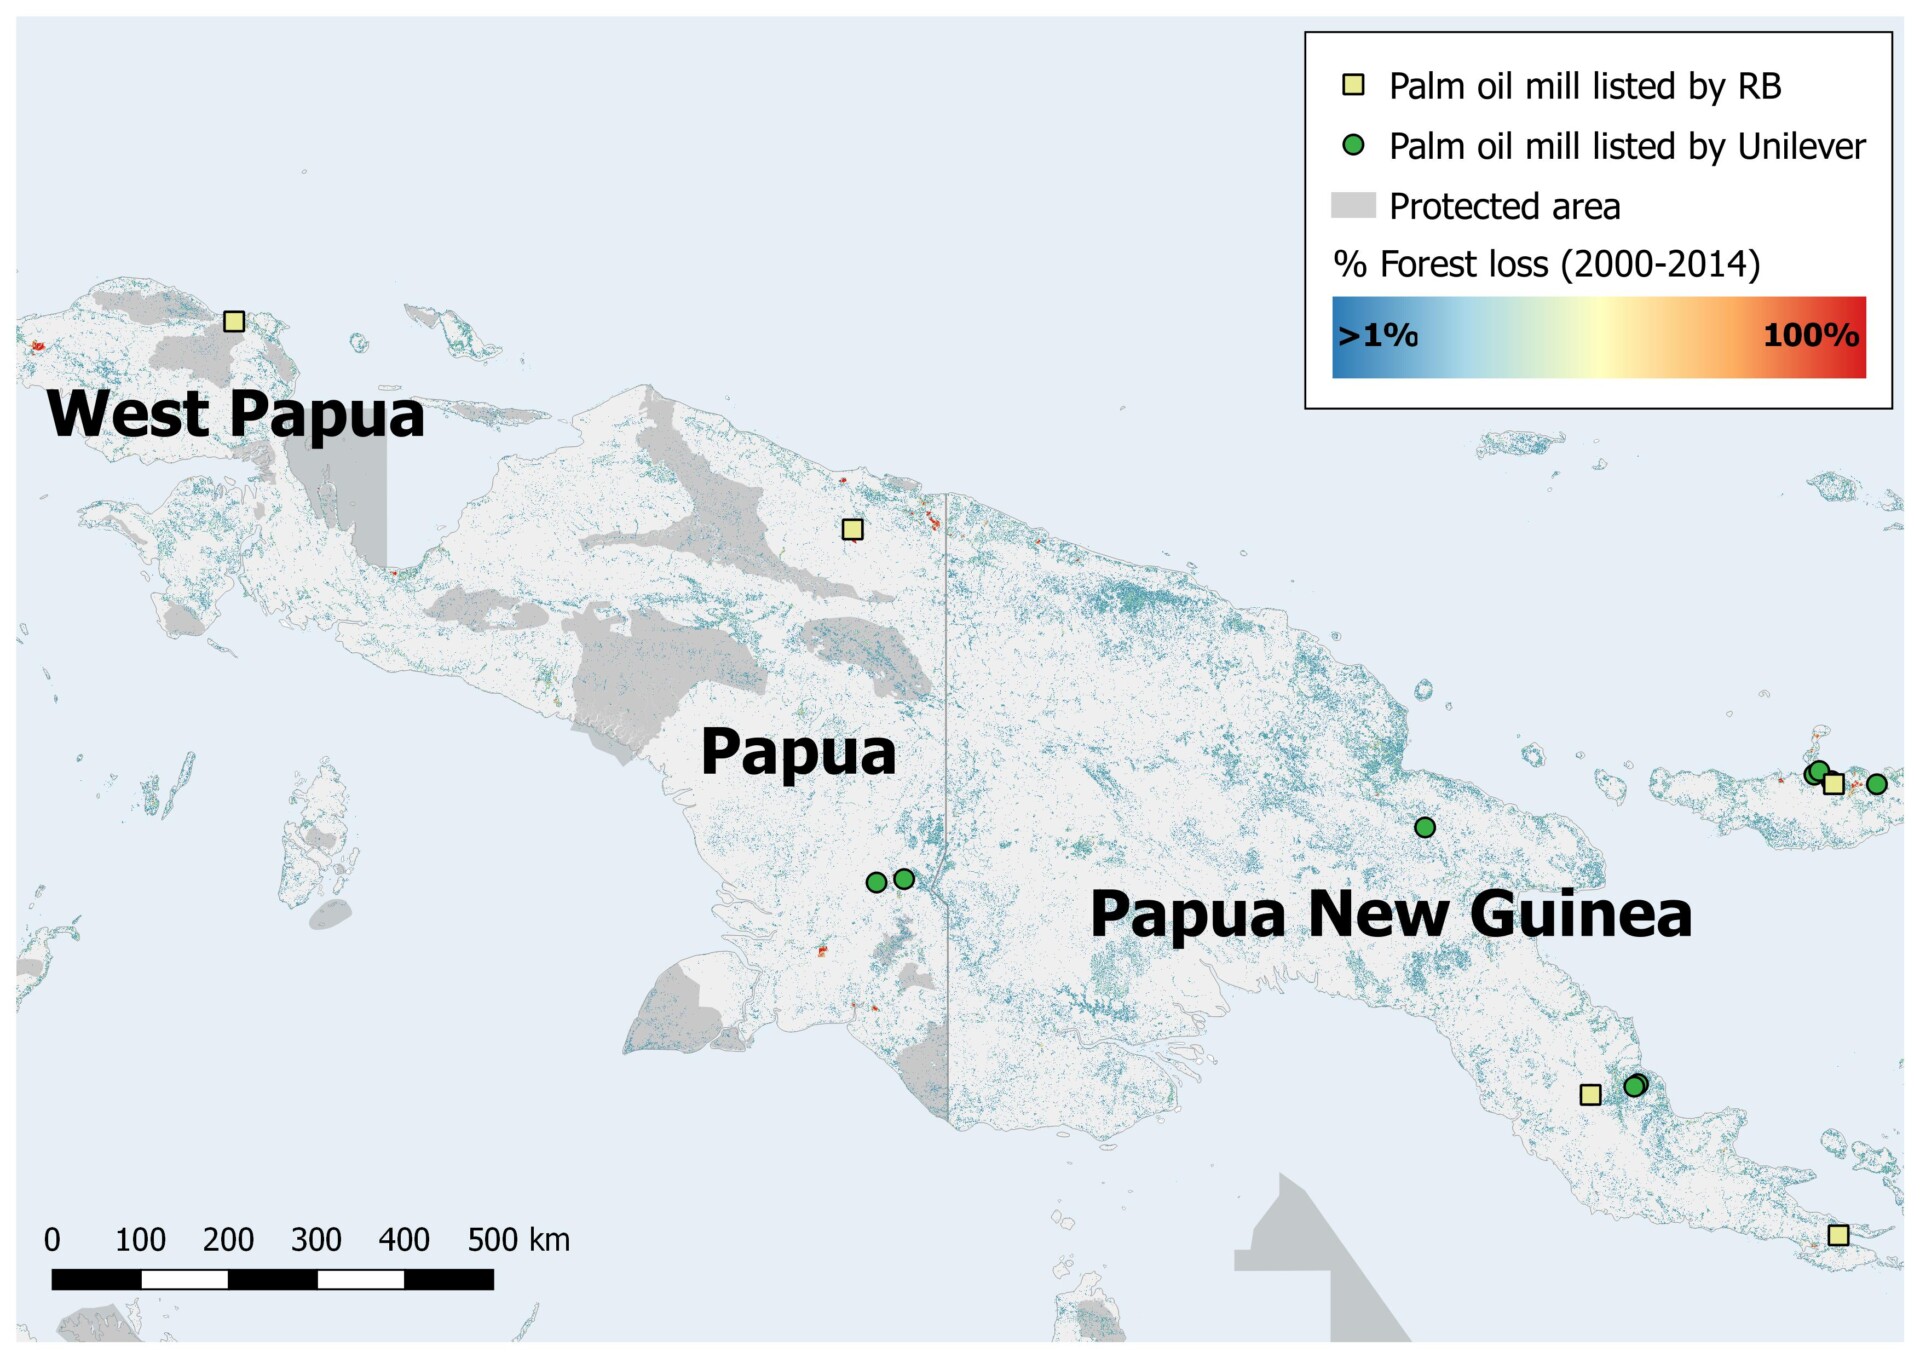
As shown on the map below, Papua is part of Indonesia and borders on to Papua New Guinea, an independent territory. Forest loss across Papua and Papua New Guinea has been widespread, though the proportion of forest loss in Papua is relatively low compared to other regions of Indonesia such as Sumatra, and Malaysia (see our last post for relevant maps of percent forest loss).

Much of Papua and Papua New Guinea’s economies are reliant on agricultural activities such as palm oil production. We know the locations of a select number of palm oil mills, based on information released under drives for supply chain sustainability by RB and Unilever earlier this year. These data show that there are four palm oil mills in Papua (one in West Papua, three in Papua), and thirteen mills in Papua New Guinea. RB state that they acquire palm oil from 7 of these mills, and Unilever state that they acquire palm oil from 16 of these mills (with 6 instances where they both acquire palm oil from the same mill).
Protected areas in Papua are represented as the grey regions on the map above, and consist of several different IUCN categories:
- Strict nature reserves and wilderness areas
- National Parks
- Natural monuments/features
- Habitat/species management areas
- Protected landscapes
- Protected areas with sustainable use of natural resources
For instance, the Foja mountains in the north of Papua are a Category 4 protected area, with protection against deforestation and infrastructure development (e.g. road construction) due to rare flora and fauna found in this region (such as a new species of Honeyeater bird discovered in 2006).
Recent forest change in Papua
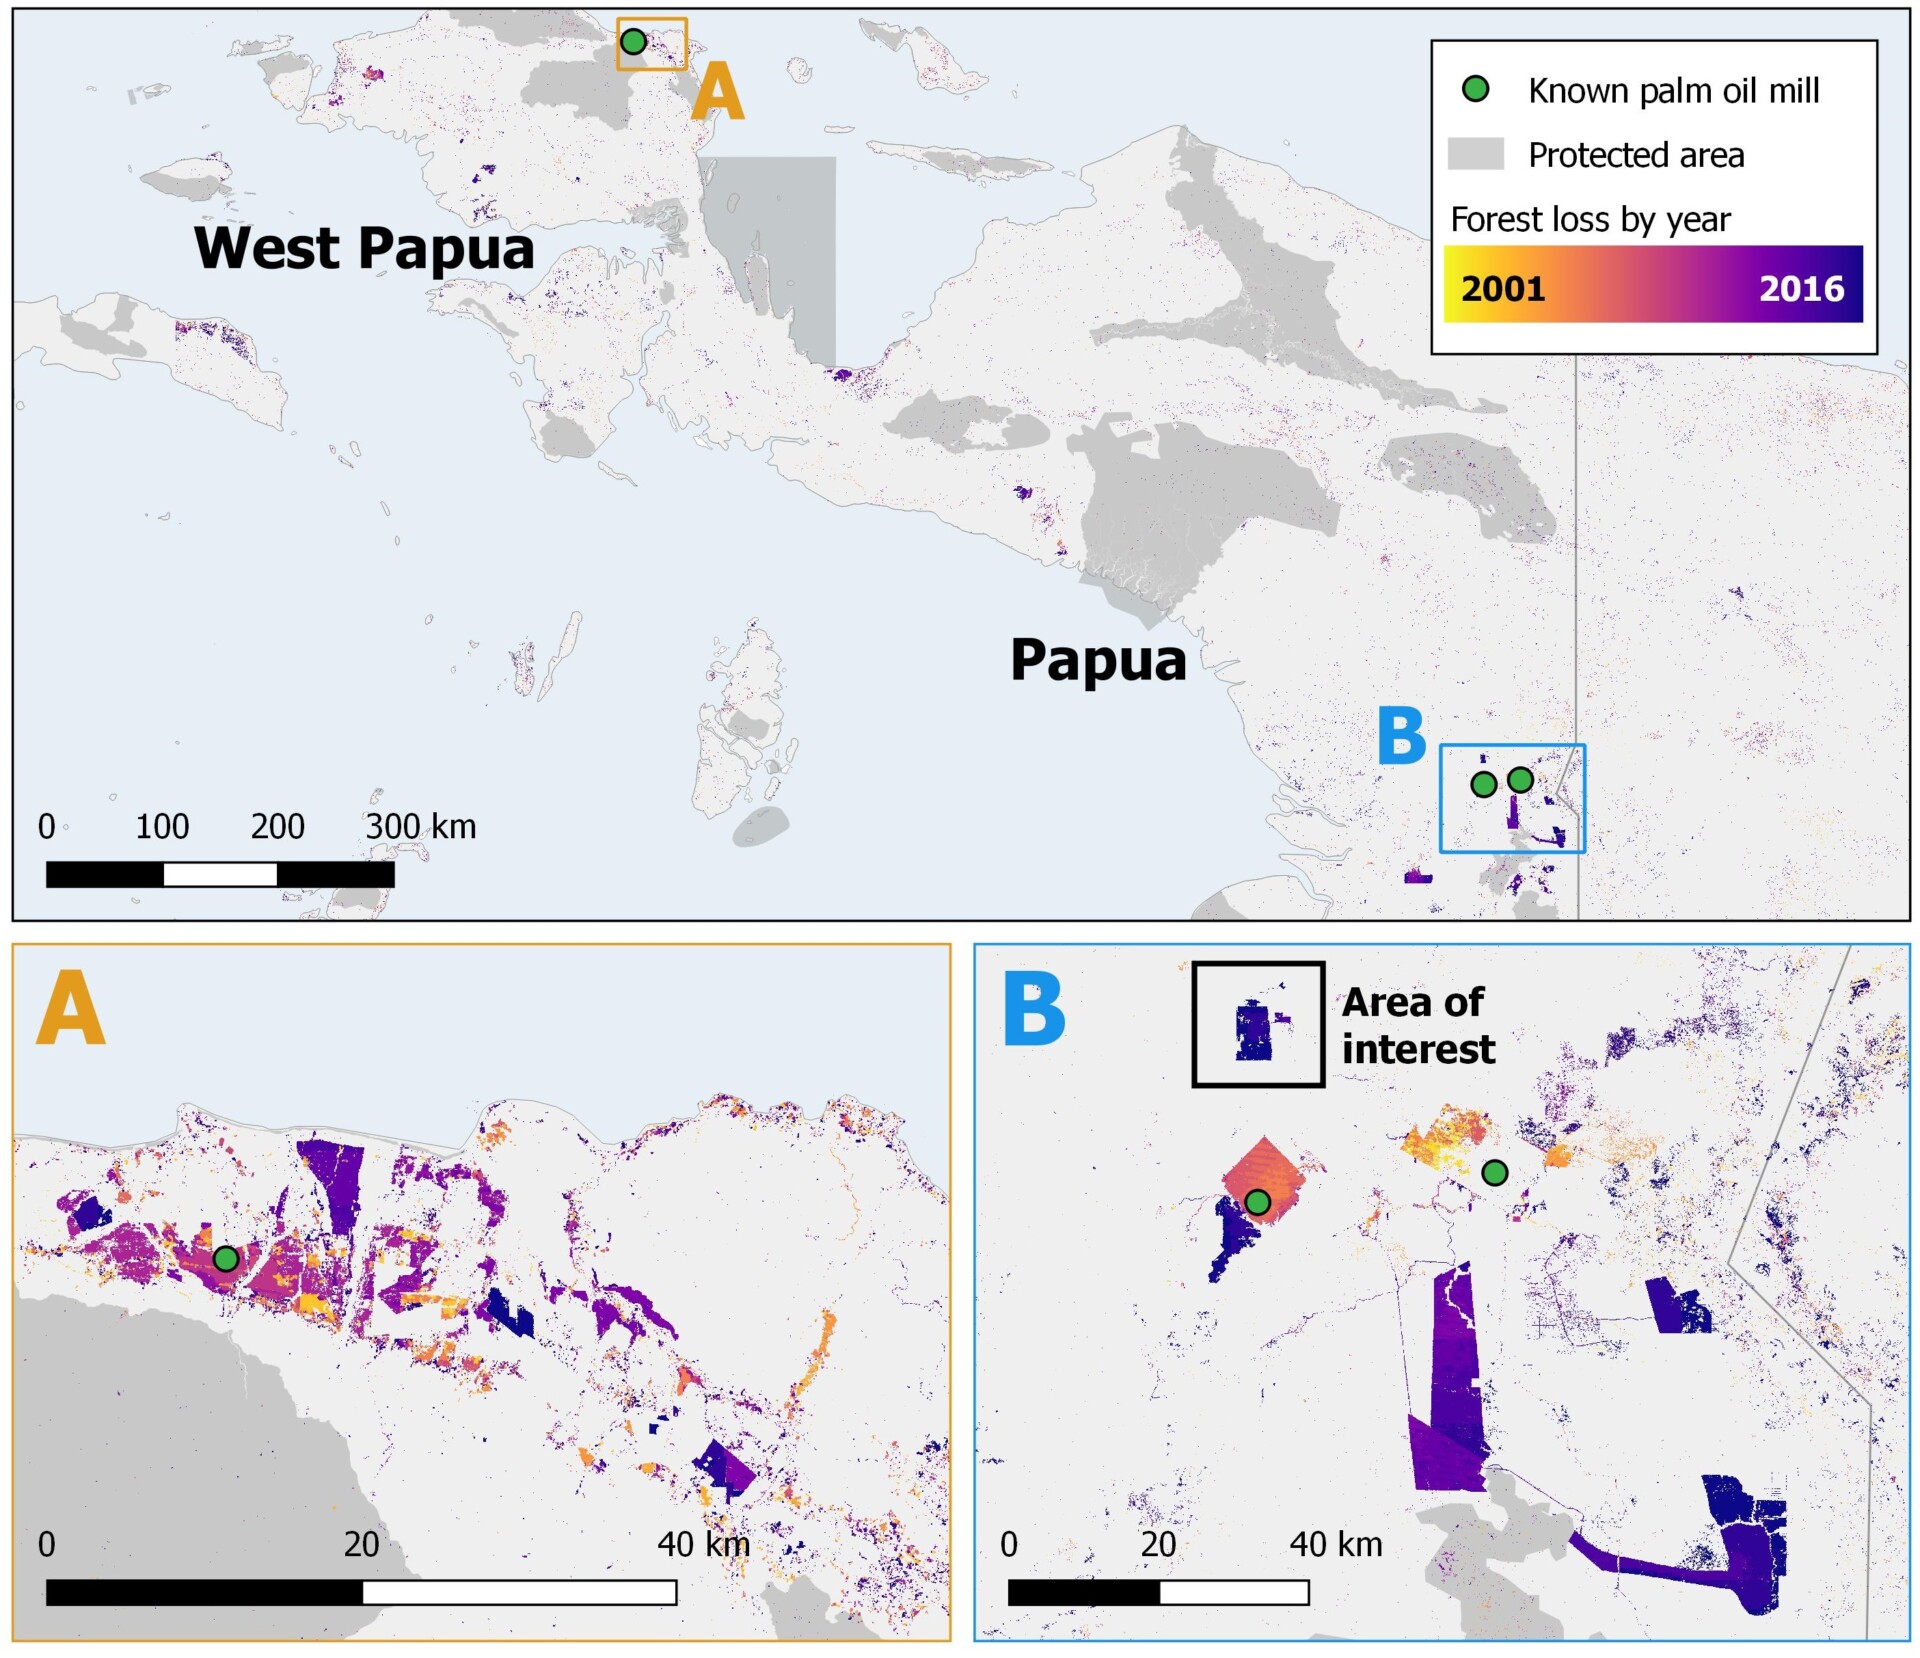
We’ve used detailed data on global forest loss from 2000 to 2016, from researchers at the University of Maryland (Hansen et al., 2013) who make these data sets freely available online. We have plotted these data across Papua and West Papua on the map below, alongside the locations of the three known palm oil mills published by RB and Unilever. The yellow/orange colours on this map indicate older forest losses (2001-2008), whilst the pink/purple/blue colours indicate more recent forest loss (2009-2016). The darkest shade of purple signifies forest loss in 2016.

It is difficult to pick out distinct patterns when we look at forest loss across the whole of the Papua/West Papua region. However, patterns become apparent when we zoom in to specific areas. We have chosen to look at the areas surrounding the known palm oil mills (Maps A and B). Map A will be form the focus of this article (Papua palm oil production: Part 1), whilst Map B and the matters surrounding it will be discussed in a separate article (Papua palm oil production: Part 2).
Medco Papua Hijau plantation comes under pressure for increased deforestation for palm oil production
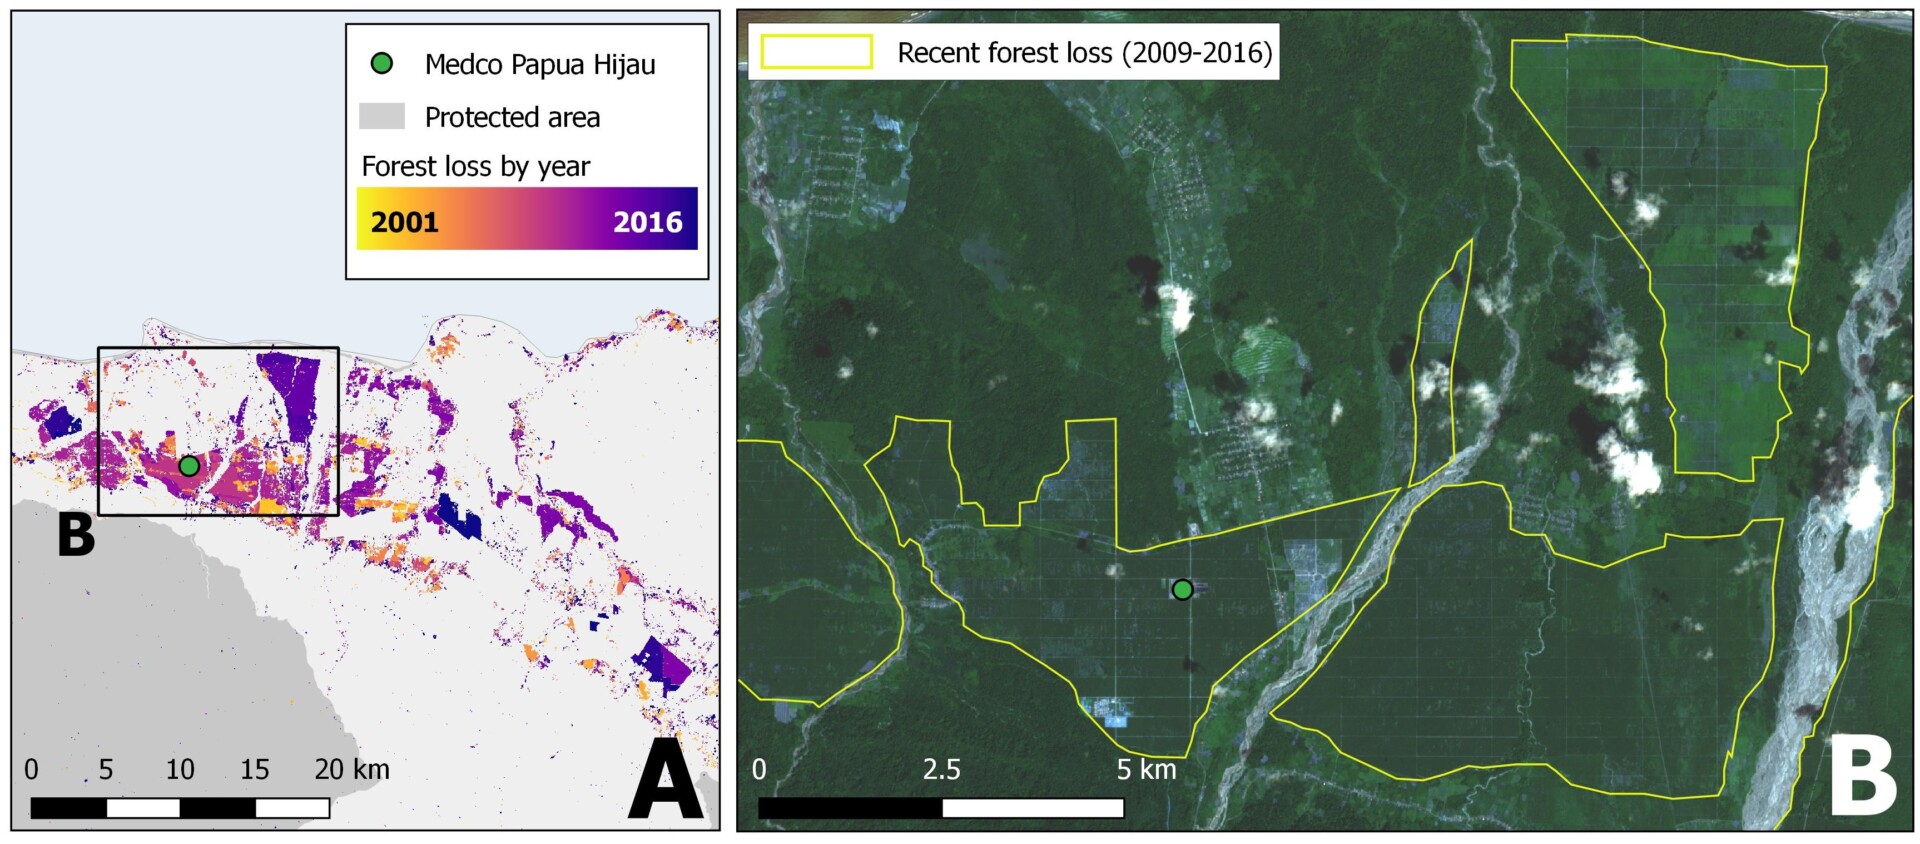
Map A shows large scale forest loss since 2001. The large geometric patches of forest loss suggest that this has been caused by industrial activity. This has been ongoing since 2001 (i.e. the beginning of the forest loss data set from GFW), but the purple and pink colours on the map signify that a lot of this activity has occurred in more recent years (i.e. 2009-2016).
The palm oil mill in Map A is called Medco Papua Hijau, which is not certified by the RSPO (Roundtable on Sustainable Palm Oil) at the time of writing. Medco Papua Hijau likely sources palm oil kernels from the plantations in these cleared areas. This is shown better in the maps below, with a map of forest change around Medco Papua Hijau (Map A below). This is accompanied by a Sentinel 2 satellite image (captured 21st November 2017) in Map B. The yellow borders show some of the more recent forest loss surrounding the mills site.

Unilever, P&G and RB have released their palm oil mill supplier information in the last year, as part of a drive for supply chain transparency. Medco Papua Hijau is named as a palm oil supplier for all three of these companies. Together, these three make up a significant proportion of the market in common household products, supplying products containing palm oil such shampoos, margarines, soaps, and ice creams. There are plenty of articles which provide more information on what products contain palm oil such as the BBC and WWF.
Therefore by releasing their supply chain, increasingly transparent companies such as Unilever, P&G and RB are helping provide the first steps in linking palm oil plantation sustainability with the products we consume:
- We know which companies make which products
- Thanks to Unilever, RB and P&G we are beginning to discover which mills these companies buy from, and also where these mills are located
- We can then assess the relationship between mill locations and forest change. This is an encouraging step to achieving traceability and transparency in supply chains
- Then, by shifting palm oil sourcing away from such sites with allegedly worse evironmental performance, palm oil consuming companies could begin re-assure customers that their are being produced with sustainably-sourced ingredients
Next, we will be looking at a different region of Papua to continue our endeavour to monitor forest change and oil palm production…

