Why 69% of forest carbon loss goes undetected
The image most people have of tropical deforestation is large and unmistakable: vast areas cleared for agriculture or cattle ranching, visible from space as hard geometric edges cutting into forest. That picture is real. But it describes only part of the problem.
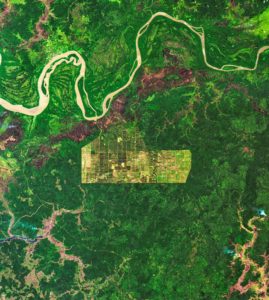
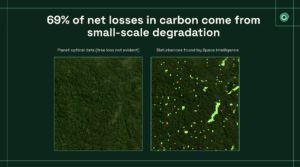
A significant share of tropical forest carbon loss happens gradually, through processes that don’t leave obvious clearings. Smallholder agriculture, slash-and-burn farming, and selective logging — where high-value trees are removed while surrounding canopy remains largely intact — erode forests in ways that are much harder to detect from above. According to recent academic research, 69% of net carbon losses from tropical forests are attributable to small-scale degradation rather than outright clearance.
That leaves REDD+ project developers and investors in the dark about the state of their forest, and most importantly, the carbon that forest is losing.
The monitoring gap
Formal monitoring and crediting cycles in carbon markets are typically backward-looking. Audit-grade datasets used to support credit issuance can relate to events from years earlier.
But in order to prevent illegal logging and degradation, project stakeholders need to know what happened last month — or last week. Earlier detection of degradation reduces the risk of losing carbon credit potential between monitoring cycles, and helps protect the biodiversity and forest conditions that underpin a project’s long-term value.
Why high res optical satellite imagery doesn’t solve this
High-resolution optical imagery can appear to offer a solution. In practice, it has significant limitations for tropical forest monitoring.
Capturing high-resolution optical imagery is expensive. Coverage is unevenly distributed: commercial and urban areas receive frequent revisits, while remote tropical regions receive far less. For freely available coarser optical data, coverage is more frequent — but persistent cloud cover across the tropics means a large proportion of images are simply unusable. (Ivory Coast, for example, has more than 200 cloudy days a year!)
Even when cloud-free imagery is available, detecting selective logging from above is difficult. Tropical forests are multi-layered. Removing canopy trees can leave the forest appearing green and intact in optical imagery. Rapid regrowth can close canopy openings within weeks. Disturbance that wasn’t captured in a clear-sky window can go undetected entirely.
What global deforestation alerts do — and where they stop
Global deforestation alert products, including RADD and the Global Forest Watch Integrated Alerts, address some of these limitations. They are available globally, and, for large-scale deforestation monitoring, remain genuinely valuable tools.
Their limitation is sensitivity to smaller-scale events. Alert products designed to work globally must use broadly applicable detection thresholds. In a series of internal comparisons, we found that while global alert products perform well for clear-cut deforestation, they can miss a substantial proportion of small-scale degradation — particularly selective logging, where forest cover is reduced but not removed.
How monitoring tuned to a specific site performs differently
Space Intelligence’s monitoring tool, DisturbanceTracker, uses Synthetic Aperture Radar (SAR) combined with optical satellite data to detect forest disturbance in near real-time. Rather than relying on a single image comparison, the approach uses repeated observations: disturbance is flagged when changes from a historical baseline are seen consistently across multiple passes. This makes the method more resistant to noise and false positives.
Because SAR operates through cloud cover, the approach works reliably in regions that optical-based methods struggle with — Central Africa, parts of Central America, and the islands of Indonesia among them.
Detection thresholds and baselines are set for the specific site being monitored, rather than calibrated globally. That specificity is what drives the performance differences described below.
What the comparison shows
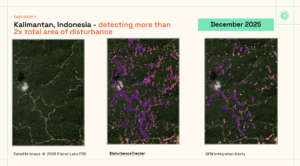
In Kalimantan, Indonesia, DisturbanceTracker detected more than twice the disturbed area identified by an integrated open-source alert product over the same period. The additional detections included evidence of selective logging and small-scale clearing that the global product did not flag.
In a logging concession in Gabon, open-source integrated alerts identified only a few small patches. DisturbanceTracker detected 5x the total area of disturbance than GFW. Importantly, those detections were validated against independent evidence from lidar overflights — confirming that the alerts reflected real structural changes in the forest, not sensor artefacts.
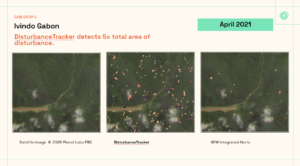
Timing differences were consistent across both cases. In the Gabon example, open-source alerts appeared late and in small numbers; DisturbanceTracker flagged changes several months earlier. In Kalimantan, alerts arrived weeks to months ahead of the open-source product — providing additional time to investigate and respond.
When to use near real-time monitoring
Near real-time disturbance monitoring supports decision-making in several contexts.
Project managers with direct control over a site can direct on-the-ground teams toward alert locations before degradation becomes entrenched, rather than discovering problems during a formal monitoring review.
Portfolio managers can track monthly disturbance rates across multiple projects, identify unusual spikes, and follow up with project developers in close to real time. This is difficult to do with alert products that update annually or only flag large events.
Supply chain compliance: tracking whether deforestation has occurred recently in sourcing landscapes for commodities such as coffee, cocoa, or palm oil.
Part of a broader monitoring suite
DisturbanceTracker sits alongside other tools designed for different forest conditions and risks. GrowthTracker provides alerts for areas transitioning from open land to forest, tracking whether trees are establishing as expected during early reforestation years — relevant for newer ARR projects where the growth signal itself is the thing to monitor. FireTracker tracks burning events over recent months and through time, supporting management in landscapes where fire frequency is a risk indicator or where fire near intact forest is a warning sign.
Each tool can be deployed individually based on project needs and set up to provide ongoing monitoring through the same platform.
If you’re monitoring a REDD+ project or managing a forest carbon portfolio, talk to our team to find out how DisturbanceTracker fits into your monitoring workflow.