Why high-integrity carbon projects in Indonesia demand higher quality maps
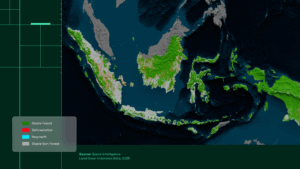
According to our newly released national Indonesia report, which maps land-cover change and carbon potential across the archipelago, Indonesia’s lost over 4.8 million hectares of forest in the last decade and faces a 0.5% annual deforestation rate (2020-2025). Though it’s higher than the official national estimates, it’s still lower than reported by some global maps.
So why the discrepancy?
Our reports are built using our audit-grade land cover data of Indonesia at 10m resolution, and present one of the most accurate pictures of Indonesia’s forests to date. To prove this, we compared our maps against the two most widely used public products – JRC’s Tropical Moist Forest dataset and Global Forest Watch tree-cover loss – to determine where public data performs well, where it doesn’t, and what additional value high-accuracy mapping brings to organisations developing forest carbon projects.
How we tested the maps
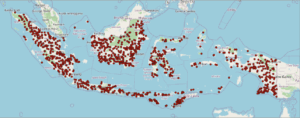
We evaluated forest and deforestation accuracy across Indonesia using a stratified random sample of over 1,000 points. Each point was assessed ‘blind’ by expert ecologists – meaning the reviewer looked at the point using high resolution satellite data at multiple timepoints and made an assessment with no knowledge of whether any of the maps had identified the point as stable forest, stable non-forest, or deforestation. This ensures unbiased, independently verified results.
Because Indonesia’s forests are mostly closed-canopy tropical forest and the country contains large areas of active forest clearance, free and open global satellite-based maps should, in theory, perform strongly here. The comparison demonstrates therefore what additional value Space Intelligence data can offer even in places like that.
To align products for a fair comparison:
- Space Intelligence and JRC have full forest + deforestation layers for all years, so no pre-processing was required.
- GFW, which only maps tree-cover loss, required constructing a 2000 baseline forest mask using its own 10% canopy cover threshold, then propagating that map forward to 2019 using the loss and gain data within GFW.
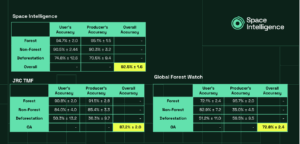
Once aligned, we assessed accuracy across change classes – forest, non-forest and deforestation – for 2019-2023.
What the results show
Public datasets remain extremely useful for global awareness – but they are not fit for detailed feasibility studies, baselining or MRV in Indonesia. Here’s why.
- Open maps misclassify forest vs non-forest far more frequently
Space Intelligence maps do a much better job of showing where forests actually are, following Indonesia’s forest definition. In fact, part of the reason why global datasets don’t perform so well is that they don’t match Indonesia’s official forest definition – for example, the Hansen and JRC datasets include all tree cover, including some timber and even palm oil plantations. JRC TMF map errors related mostly to incorrectly mapping timber, palm oil or coffee/cocoa plantations as forest, and therefore detecting as deforestation the harvest of timber trees or clearance and refreshing of a coffee plantation, even though these are not deforestation.
At the other end, as they rely on optical satellite data only (as opposed to optical and cloud-penetrating radar as in the Space Intelligence maps), they miss some deforestation that was masked by cloud-cover – it can sometimes be years before a good cloud-free image is available over Indonesia, and in that time forest or plantation trees can regrow.
This results in:
- JRC made ~13% more errors
- GFW made over 27% more errors
These misclassifications have direct implications: determining eligibility and baselining for conservation and restoration all begin with the simple question “what is forest today (and has it been forest for the last 10 years)?” If that answer is wrong, everything downstream is compromised.
- Deforestation detection is significantly more reliable in SI maps
These maps can misrepresent forest cover, which means they also misclassify deforestation. Routine timber plantation clearings are labeled as deforestation – even though they release carbon, they aren’t truly deforestation under the standard definitions as the forest has already been cleared to make the plantation, and the trees will be replanted.
Both JRC and GFW showed higher rates of:
- False positives (identifying forest loss where none occurred)
- Missed changes (failing to detect real deforestation)
These issues directly affect project design: false positives inflate risk estimates and increase the risk of overestimating carbon potential; missed changes produce misleadingly optimistic narratives and can have the opposite effect.
Why it matters for Indonesia’s carbon landscape
Indonesia is positioning itself as the leader for high-integrity nature-based solutions in Southeast Asia – a message echoed across government announcements this past year and reinforced at the Global Carbon Summit in Jakarta we attended last week.
High-integrity projects depend on stakeholder confidence, and accurate mapping is the foundation of that trust. In this context, even a 10-20% error rate can significantly reduce the value of a forest carbon project – and in some cases, determine whether it attracts investment at all.
We are committed to building that confidence. The higher accuracy of our mapping provides project developers, investors, and auditors with a solid basis for feasibility assessments and ongoing monitoring, supporting stronger, higher-quality NbS projects in Indonesia.
See the full application inside the Indonesia report
This accuracy assessment underpins every map and consequent statistic in our national Indonesia report.
To see how the data is applied – island by island – and how this data translates into REDD+, ARR and mangrove potential: Download the full report here