Distinguishing intact forest from degraded forest in Cameroon
One of the hardest tasks we’re ever asked to do using satellite data is to separate ‘intact’ forest, i.e. forest that is broadly undisturbed, from forest that has been degraded to some degree or another. This is because the forest degradation process can often be very subtle, with only a few trees removed from a large area of forest, and the top of the forest canopy remaining ‘green’ as seen from a satellite.
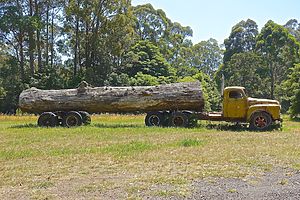
For example, degradation in the tropics is often due to logging, which unlike the image in people’s head does not normally involve clear felling the forest, but instead removing the 1-2 trees per hectare (100 m x 100 m) that are of commercially valuable species and of the right size and shape. Of course felling the tree and removing it from the forest causes further destruction, but secondary vegetation grows back so quickly in tropical forests that any canopy gap visible from a satellite disappears quickly.

(Free image from https://pixabay.com/en/log-truck-wreck-logging-truck-log-557539/)
As an example we’ve looked at mapping forest types in central Cameroon, around the capital Yaounde. I know that much of the forest in the area is heavily disturbed, especially within logging concessions and around roads, but also that much intact forest still exists, even outside protected areas.
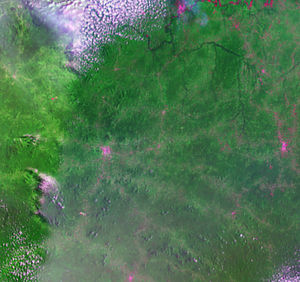
However, in a traditional Landsat optical satellite image, apart from cities and farmland, which are pink and sand, and the large rivers (blue), the forest looks green whether intact or degraded:

(Landsat 8 from January 2017, data provided by USGS/NASA)
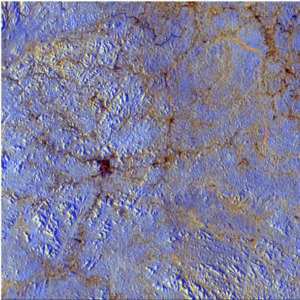
By contrast in a radar image there is no cloud cover, and the forest appears different colours (blue vs brown) depending on disturbance. However, there are other issues here, related to terrain and radar noise:

SAR data provided by the European Space Agency’s Sentinel-1A satellite.
Inevitably the best classifications result from combining different data types, as our Chief Scientific Officer’s research has shown (link https://www.mdpi.com/2072-4292/8/1/70 ). This approach is known as ‘data fusion’. Difficulties come in ensuring the different datasets line up, and that artefacts from each (for example cloud cover in optical data, terrain in radar data) do not enter the final product.
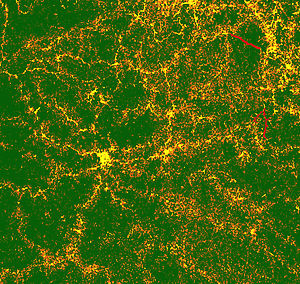
Using the advanced data fusion and machine learning techniques we have developed at Space Intelligence, we’re able to use a combination optical and radar data scenes from multiple dates to remove the problems associated with each type of data, and produce pure and accurate classifications. Here we combined Sentinel-2 optical data, Sentinel-1 radar data, and Landsat optical data to produce a useful classification.
It became obvious during the classification process that there was a third type of forest in our study area: there was also some seasonally flooded forest, that looked green in the optical data, but behaved very differently through the year in the radar data. As radar can look through the forest canopy, it was seeing the seasonal cycle of flooding and drying out in these forests. As such forests often harbour peat, and are composed of different species, mapping such forests could be very important from a carbon storage and biodiversity standpoint (link to article the journal Nature ).
Here’s the finished classification:


We hope this provides some useful background to the use of fusion data in classification of tropical forests. If you would like to see how we could assist you with landscape classifications, please do not hessitate to contact us on our webform; or to speak directly, please write to [email protected].

