An introduction to active remote sensing for environmental monitoring
Our visiting scientist, Dr Penny How, is being supported by NERC to lend her expertise to Space Intelligence. Dr How specialises in glaciology, and uses both field and remote sensing data to monitor ice flows in Svalbard. She has written an overview of the use of active remote sensing for environmental monitoring, below. Enjoy!
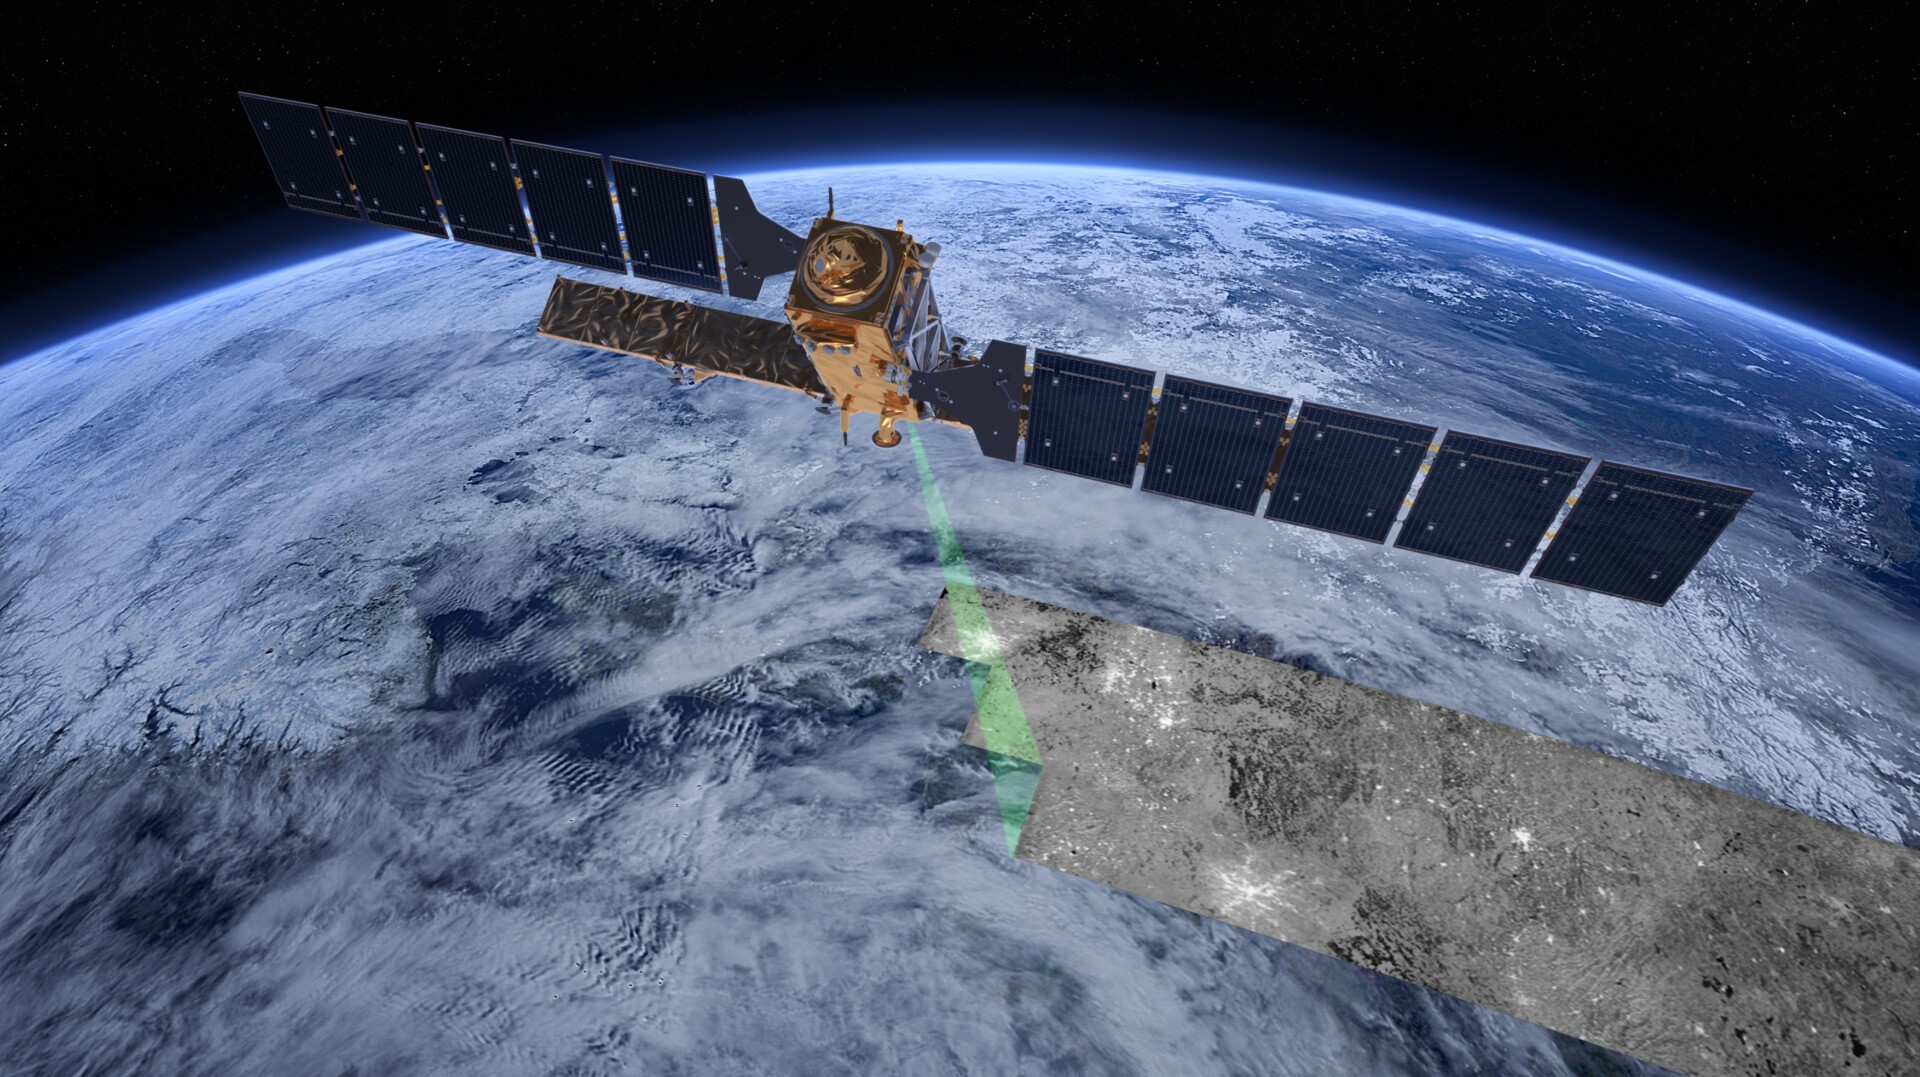
Satellite data is valuable to scientists for mapping natural features worldwide and monitoring changes through time. We often work with satellite images captured from a satellite pair called Sentinel 1 from the European Space Agency. The two satellites in this pair are called Sentinel 1a and 1b, orbiting on opposite sides of the Earth to one another. The satellites orbit and capture images of the entire Earth’s surface every six days.

Sentinel 1 captures images using Synthetic Aperture Radar (SAR), which is commonly referred to as radar imagery. Unlike optical imagery, which is captured in the visible spectrum, radar imagery is advantageous to us because coverage is unaffected by cloud cover and lighting. Images can be taken even in bad weather or at night.

At Space Intelligence, we use these images to map land cover, particularly in the cloudy tropics. We can produce a series of maps over the same area at regular time intervals thanks to the fast repeat orbit of the Sentinel 1 satellites. By conducting repeat surveys, we can look at changes in forest cover over. This is key to the monitoring of deforestation for REDD+ projects, and Zero Deforestation Commitments. The information that we gather can be used subsequently to inform policymakers about vulnerable areas; report on annual deforestation and forest degradation statistics, and support environmental planning and impact assessment.
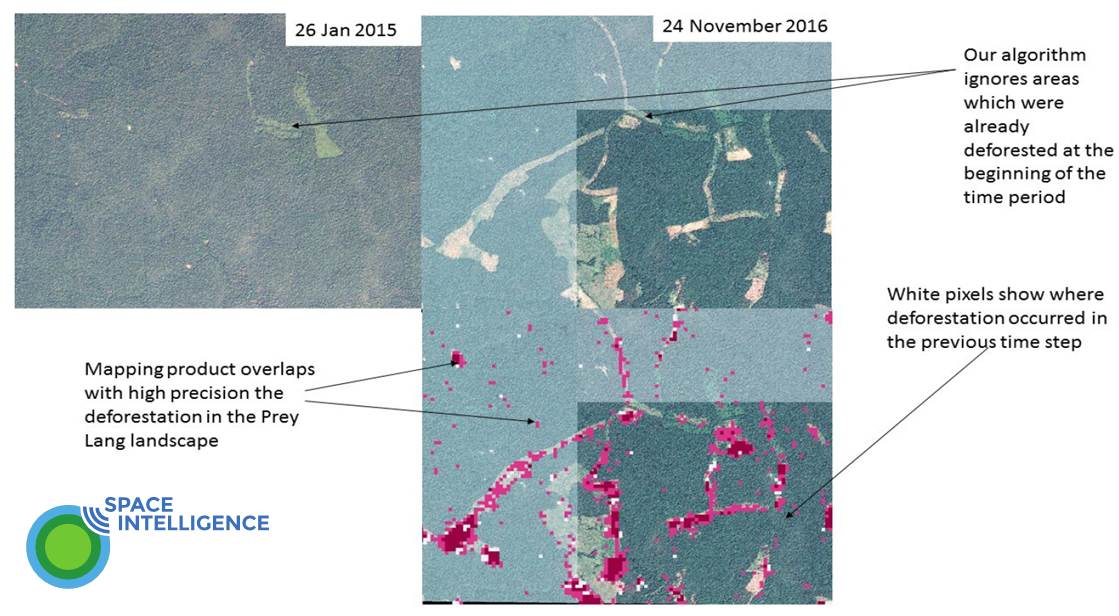
Deforestation mapping in Cambodia

The above image shows the result of our analysis of SAR data over the cloudy forests of Prey Lang in Cambodia. The high resolution optical imagery we used for validation shows that our approach is ~89% accuracte.
Lidar
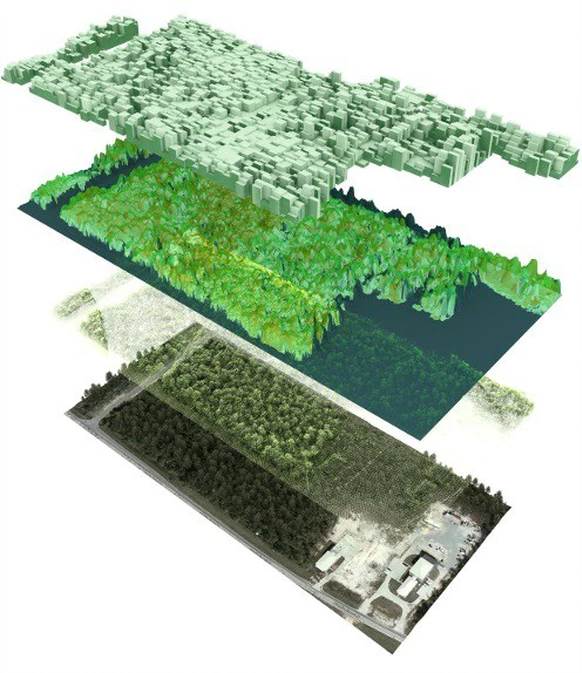
Radar imagery can also be used in combination with other surveying methods. For instance, whilst radar imagery from Sentinel 1 is effective for monitoring deforestation over large areas, it is limited to detecting change in the uppermost part of the forest canopy. Depletion of the mid-section of the forest canopy is an inherent problem in regions such as Ghana, where vast areas of the middle canopy are cleared for cocoa plantations. In such cases, a surveying technique called LiDAR (Light Detection And Ranging) can be used to monitor changes throughout the forest canopy and fill in this ‘gap’. Carbomap specialises in using LiDAR surveys to produce three-dimensional representations of forested areas over small regions. The combination of the two methods provides a detailed understanding of forest cover and canopy structure that can be effectively visualised.

Sentinel imagery, along with other satellite radar data, provide abundant information that is invaluable to all environmental disciplines. The examples shown above demonstrate how vital Sentinel 1 imagery is for current environmental monitoring, and the continuation of this data acquisition is intrinsic to future monitoring. A new pair of Sentinel satellites are currently in the process of being launched to continue this endeavour, with Sentinel 3a launched on 16th February 2016 and Sentinel 3b scheduled to launch on 25th April 2018.
Radar for glaciology
Whilst we don’t provide glacial mapping, it is interesting to see how the technology is being used in other disciplines to monitor the Earth’s surface. It is particularly useful for surveying glaciers in the polar regions, where daylight hours can be limited at particular times of the year. Scientists have been using Sentinel 1 imagery to monitor the dynamics of glaciers, for instance. By looking at differences between sequential radar images, several important aspects about glaciers can be determined such as their areal extent and how fast they are flowing.


