Solving for Cloud Cover in Forest Carbon Project MRV
With the majority of forest carbon projects located in the tropics, did you know one of the key challenges in mapping in these regions is cloud cover?
In some areas we work it can be cloudy 90% of the time or more, which means most of the time a satellite passes over it just sees white!
This can create challenges for producing land cover maps via remote sensing as we need a cloud-free view to build up the data through the year we use to produce high quality maps.
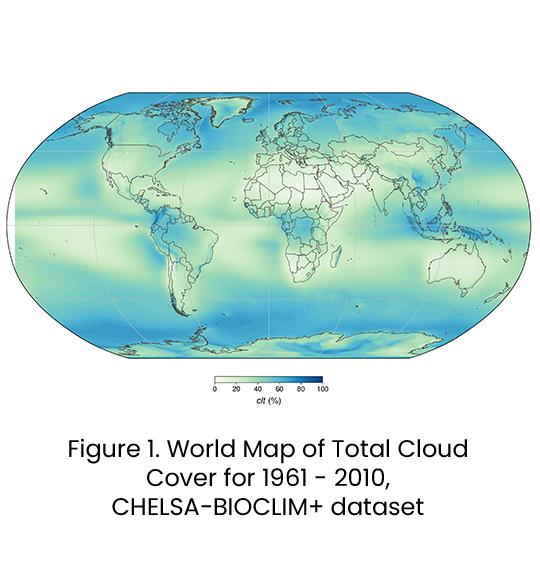

Just how cloudy is it over tropical forest areas?
Clouds are concentrated globally over tropical forests, mountains, and polar regions. See figure 1: the areas over 80% are mostly found over tropical forest areas. You can see this across South America, Western Africa, and much of Southeast Asia, which account for the vast majority of forest carbon projects globally.
What impact do clouds have on data output?
Clouds will significantly impact the accuracy of land cover maps, resulting in noisy maps and two primary issues:
1. Underestimating canopy height and above-ground biomass
The below image shows an example of Meta’s forest canopy height map in a section of central Brazil Amazon and how clear artefacts are caused by cloud cover not removed (dark blue patches) and inconsistent height estimates between different scenes (rectangular artefacts).
When looking at the cloud-free satellite image, it’s clear as a validation that the Amazon rainforest does not really jump from 10m to 30m high forest in rectangular stages – this whole area has pretty uniform forest height of between about 25m and 35m.
In comparison, the Space Intelligence map over the same areas shows no cloud-related artefacts and a high accuracy, which can meet the thresholds of carbon or compliance markets.

2. Incorrect land cover classifications
These quality issues can occur even when there have been attempts to correct for them: for example, by stitching together different satellite scenes that were partially cloudy, in order to produce a ‘cloud free mosaic’.
If there are inconsistencies in these mosaics, it can introduce errors in the classification, meaning there could be over- or under-estimations of the areas of certain classes, and incorrectly flagged as having changed as figure 3 below shows.
Image 1 below shows a closed canopy forest landscape, where clouds in an original image have been filled by a second one, which is cloud free in the places where clouds were present in the first. Unfortunately the colours between the two scenes do not match, as likely they come from different times of year. Image 2 shows how applying a simple land cover classification is impacted by this base image with dense forest incorrectly classified as agricultural land in the areas impacted by cloud.

How to Accurately Solve for Cloud Cover in Remote Sensing
At Space Intelligence we produce highly accurate maps globally, including in the world’s cloudiest places. We do that in a few ways:
1. Using Synthetic Aperture Radar Data
The type of satellite data used in the examples above, optical satellite data, has its signal blocked by clouds. This is the most common type of satellite data used as it’s widely available (from satellites like the Landsat and Sentinel-2 series, Planet, MODIS etc). As it’s like the images we see with our eyes, these are the easiest type of satellite data to understand.
However, there is another useful satellite type: Synthetic Aperture Radar, sometimes called SAR or just radar. This uses longer wavelengths than optical satellite data, sending its own pings of microwave radiation at the Earth’s surface and ‘listening’ for what comes back. Critically, this can see straight through cloud.
We always use a combination of optical and radar data in our maps: they both see different features of vegetation, so the combination makes our maps better. But as radar isn’t blocked by clouds, it’s especially important for making good maps in cloudy places.
Figure 4. Optical vs SAR
2. Good Cloud Masking
It used to be that satellites passed over a location only quite rarely. If parts of it were cloudy, then it was a long wait until the next chance to see the ground.
However, modern operational-quality high resolution (which we broadly define as 30m x 30m or better pixel size) is now available quite frequently. For example, at Space Intelligence the optical data in our maps is normally made up of Landsat and Sentinel-2 satellite data. There are currently two of each of these satellites orbiting, and their different characteristics mean we normally obtain an image of an area of the planet at least every 8 days for Landsat, and at least every 5 days for Sentinel-2.
Over the course of a year, in most places there is a good chance that at least some of those images will be cloud-free. However, in cloudier locations such as the tropics there will likely be at least partial cloud cover in all images. And if you then want images in the cloudier parts of the year, it’s certain there will be clouds.
You can still use these data. But to do so, it’s important to be able to identify every pixel where clouds, including thin clouds and haze, are located in an image – to enable you to create a ‘cloud mask’. It’s also important to identify ‘cloud shadows’, areas of the ground made artificially dark by the shadows of cloud above, and add these to this ‘mask’.
If these pixels can all be identified, flagged and then masked out, then a stack of valid observations can be used. Provided you can deal well with the gaps and calibrating between images captured at different times of year, you can then use these to make a good map.
3. Humans in the Loop
Artefacts can always sneak through. To make great maps, you need experts to check how they look carefully at each stage, iterate and improve them. At Space Intelligence we take this review process very seriously, with our Ecologists and Data Scientists reviewing with a careful eye for noticing any issues related to cloud cover, or other potential issues that can appear on output maps.
If we do identify an issue, it’s back to the cloud masking process to find a way of feeding the algorithm clean data to start with: the only way to produce great maps is to start with cloud-free, artefact-free, well calibrated satellite data.