
The latest version of GHL 2026 for NbS Project Screening is here
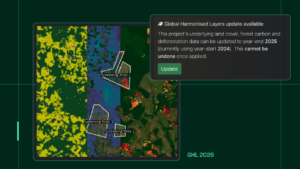
We’re thrilled to launch the latest version of Global Harmonised Layers 2026 on NbS Screening Tool.
GHL is the dataset of land cover, forest carbon and deforestation data that powers the estimates underneath NbS Screening Tool. It combines the strengths of over 18 open source datasets in a single dataset, with layers harmonised across space and years.
This new version covers to the end of 2025, so Screening tool users will be able to screen against a more up-to-date picture of what land classes exist in the area.
More data built in
We’ve added several open-source datasets. Each one strengthens a different part of the map:
- Copernicus Global Dynamic Land Cover – land use classes
- Copernicus DEM GLO-30 – land elevation
- Intact Forest Landscapes (Potapov et al.) – forest extent baseline
- CIFOR tropical and subtropical wetlands & peat distribution – wetlands and peat
- CHELSA climatology 1981–2010 – a climate covariate
- CTrees 100 m global annual above-ground biomass, 2000-2025 – forest carbon
- JAXA PALSAR-2 / PALSAR / JERS-1 mosaic and Forest/Non-Forest maps – radar-based forest mapping
A better harmonisation algorithm
Bringing many datasets into one map is the hard part. Different sources disagree, and how you reconcile them decides how much you can trust the result. GHL 2026 uses a more sophisticated machine-learning harmonisation algorithm, which produces a higher-quality, more accurate map using the most appropriate datasource for any given point on the map.
Also new in the NbS Screening Tool
ARR baselining from control plots
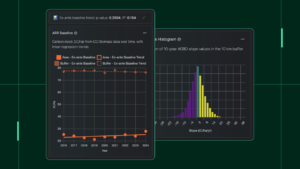
For ARR projects, the advanced NbS Screening Tool now builds a baseline from control plots – the land surrounding your project. It shows the biomass trend in that surrounding land, so you can understand the pressures the wider landscape is under and judge whether there’s a real opportunity for regrowth.
Before a project starts, the tool forecasts the performance benchmark discount from the trend in the stocking index over the 10 years before the project’s start date. Because control plots are matched to the project area, the historical trend across the project site closely matches the trend in its control plots. That means the site’s own historical stocking-index trend can be used to inform the ex-ante baseline.
Reading the slope histogram
Historical biomass trends in the surrounding land tell you how likely a positive benchmark discount is once the project is running. Where biomass is increasing on its own – without any project activity – you can expect higher benchmark discounts applied to removal credits.
To show this, the tool plots the 10-year above-ground biomass density (AGBD) slope values across a 10 km buffer zone around the project as a histogram:
- Skewed left (more yellow), average above 0 – more regrowth is already happening in the buffer, which points to higher benchmark discounts.
- Skewed centre or right (more green/purple), average at or below 0 – little or no natural regrowth, so expect minimal benchmark discounts.
Geospatial tools and map exporting
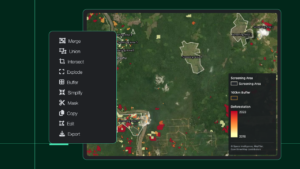
You can now edit a project’s GeoJSON directly in the platform – merge, simplify, unite, intersect, edit and create a buffer – then export the result. You can also export any map image.
Try out the new features in the platform now.
Or, if you’re curious about the NbS Screening Tool, contact us for a demo.