
Product Update: satellite viewer, protected areas and new Malaysia risk map
We’ve been busy. There are a few very exciting features in the pipeline, so watch this space. But for now, we’ve shipped 5 updates that make it easier to see what’s happening on your land and to act on it quickly.
Optical imagery from less than a week ago, anywhere on Earth
You can now view recent optical satellite imagery for any location on the planet, often from just a few days ago, so you can get the most up-to-date real-world overview of how a project area has changed over time. Recent satellite imagery is now available across every product on the platform: the NbS Screening Tool, and our Monitoring suite (DisturbanceTracker, GrowthTracker and FireTracker).
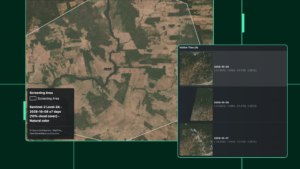
The imagery comes from Sentinel-2, with resolution as high as 10m and frequency of 5 days per each location. The platform always shows you the most recent clear view: it loads the most recent image first and, if that one is cloudy or unclear, moves to the next most recent. You can also adjust the maximum cloud cover to up to 30% to allow some flexibility in how much you want to see.
That means you can check monitoring and screening results with your own eyes – if a fire or a major loss event hits your project area, pull up the latest imagery straight away and see the damage for yourself.
You can also visually compare different years to see the impact of your conservation efforts and export these images for reporting.
This is an update we’re especially proud of, and we’re excited to see how you put it to work. Up to now, there hasn’t been an easy-to-use viewer that lets you see cloud-free, up-to-date and high resolution imagery; while Sentinel-2 data is free and accessible to any GIS expert, collating these large datasets has always been time-consuming. Now it’s built into the platform you already use, ready to become a natural part of your workflow.
DisturbanceTracker: find the biggest losses in seconds
DisturbanceTracker already shows minor forest disturbances and canopy loss on a monthly basis, so you can monitor your REDD site for any changes. It now goes a step further.
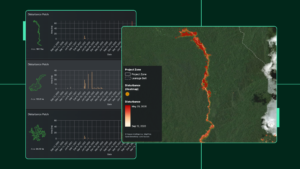
It automatically breaks forest loss into separate patches, each one a continuous area of loss, and ranks them by size. Click any patch to jump straight to it on the map and see its own timeline. That timeline shows when the loss happened and how much was lost. You can tell a bit of minor loss, like a small landslip or a few fallen trees, apart from a major event like a landslide or clearing.
Patches are split by time too. Change the date range and the list updates to show only the patches cleared in that window. No more scanning the map for red spots, zooming in and searching around. The largest losses sit at the top of the list, ready to analyse.
A global peatland layer for the Screening Tool
NbS Screening Tool now includes a global peatland layer that shows modelled peat depth at 30m spatial resolution, produced by OpenGeoHub (Isik & Hengl).
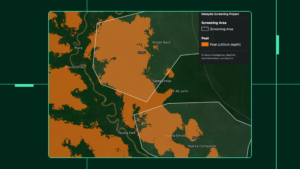
Peatlands store huge amounts of carbon, so knowing where they are can change how you assess a site, especially for REDD+. Peat can also make a project ineligible for ARR under some methodologies, so it helps to know how much is present in your project area before you go further.
This brand-new chapter of the NbS Screening Tool shows whether peat soils are present across your project area and how far they extend.
New IBAT Protected Areas
The NbS Screening Tool now checks for overlap with protected areas, using data from IBAT.
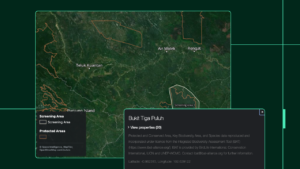
IBAT is an online database of global biodiversity data, covering biodiversity risk and protected areas. With this dataset inside the Screening Tool, you can now easily see which protected areas or national parks your potential project overlaps with, as it can make the project not eligible for most methodologies. In theory, this data should be easy to find, however, in practice, a lot of it is hidden away in PDF reports.
By partnering with IBAT to bring these areas into the platform, we’ve made it easy for investors and stakeholders to get better context on their potential projects.
Malaysia is now available for REDD+ screening
We’ve added a deforestation risk map for Malaysia, so you can now screen potential REDD+ projects across the country.
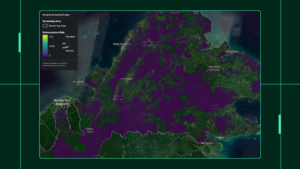
We built this map using the same best-practice process behind the official Verra risk maps we’ve delivered over the past year as the official Verra DSP.
Malaysia has a lot of forest and a lot of potential, and now you can see where the best opportunities are before you commit time and money.
Want to see these in action? Book a demo with our team.